Projects
OpenTeams is an open source platform to visualize team data. It is designed for email metadata, and also, includes validated surveys regarding personality (big five) and morals (moral foundation). You can access OpenTeams.
Augmented Democracy is the idea of augmenting the participatory and decision making capacities of people by providing them with a digital twin. Here, you can get a gist of the idea on augmented democracy.
DIVE is a data integration and visualization engine that allows users to transform data into stories, by facilitating visualizations through recommendations, and providing an statistical tool including multivariate statistics. DIVE was created by Kevin Hu, as part of his Masters and PhD work at the Collective Learning group at the MIT Media Lab (paper)


Shout! Can I borrow your network? Shout! is a marketplace for retweets that allows people to exchange micro-contracts for future retweets. Shout! facilitates the coordination of social media diffusion efforts by groups.
Shout! was created together with Ambika Krishnamachar as part of her requirement for a Master's of Engineering.
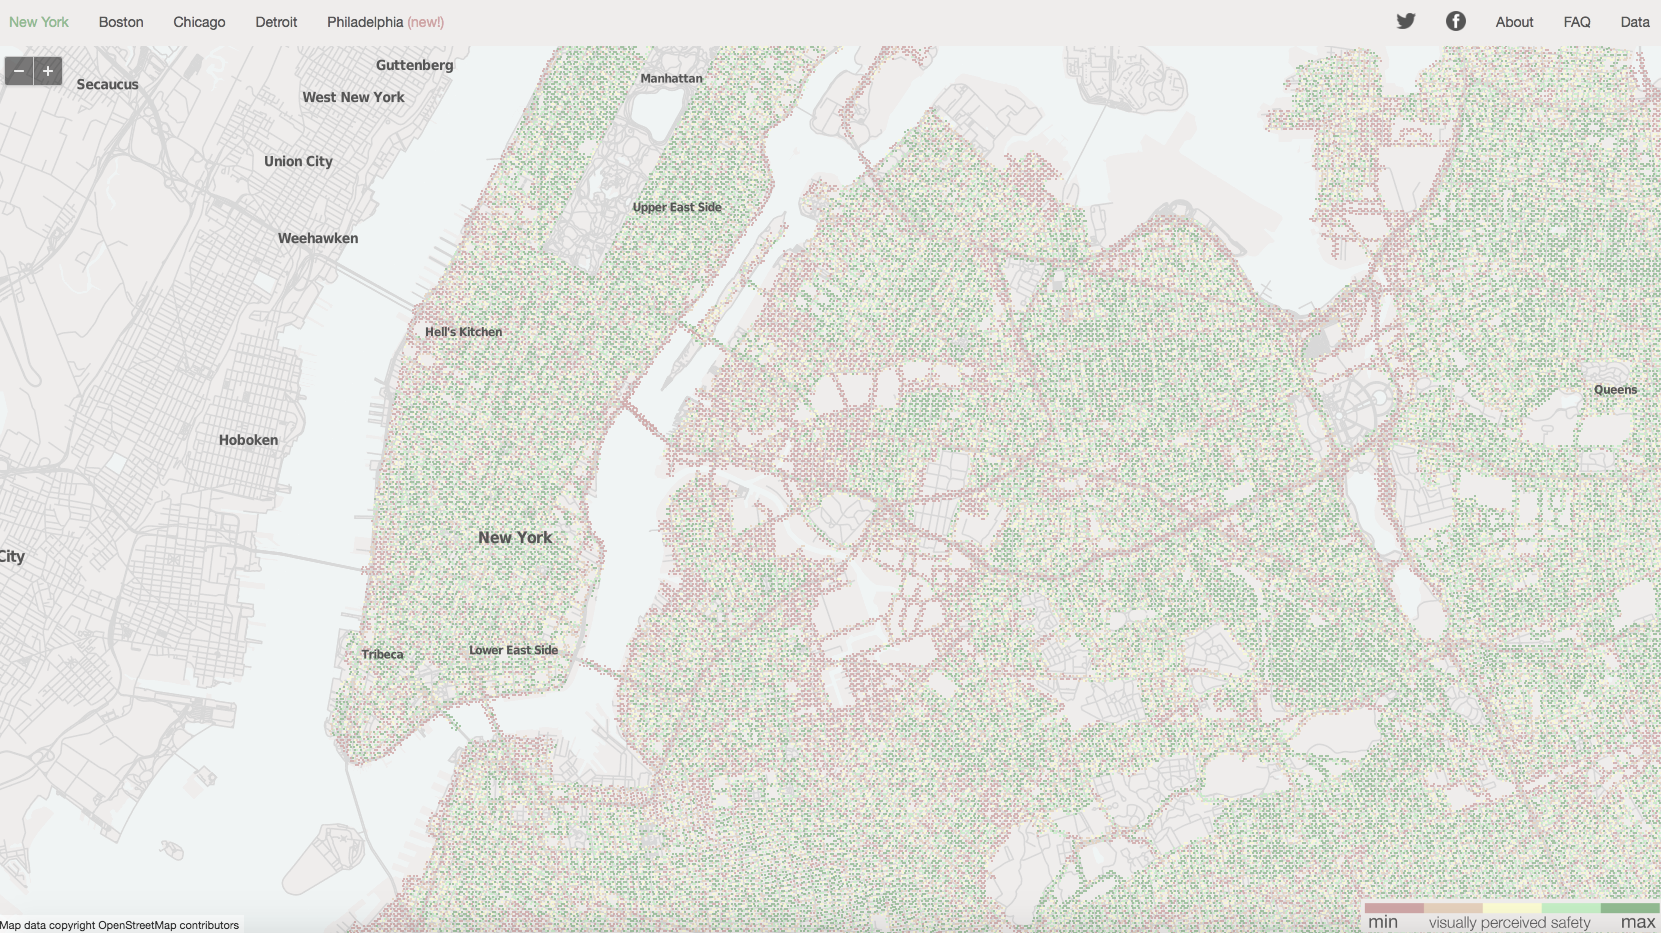

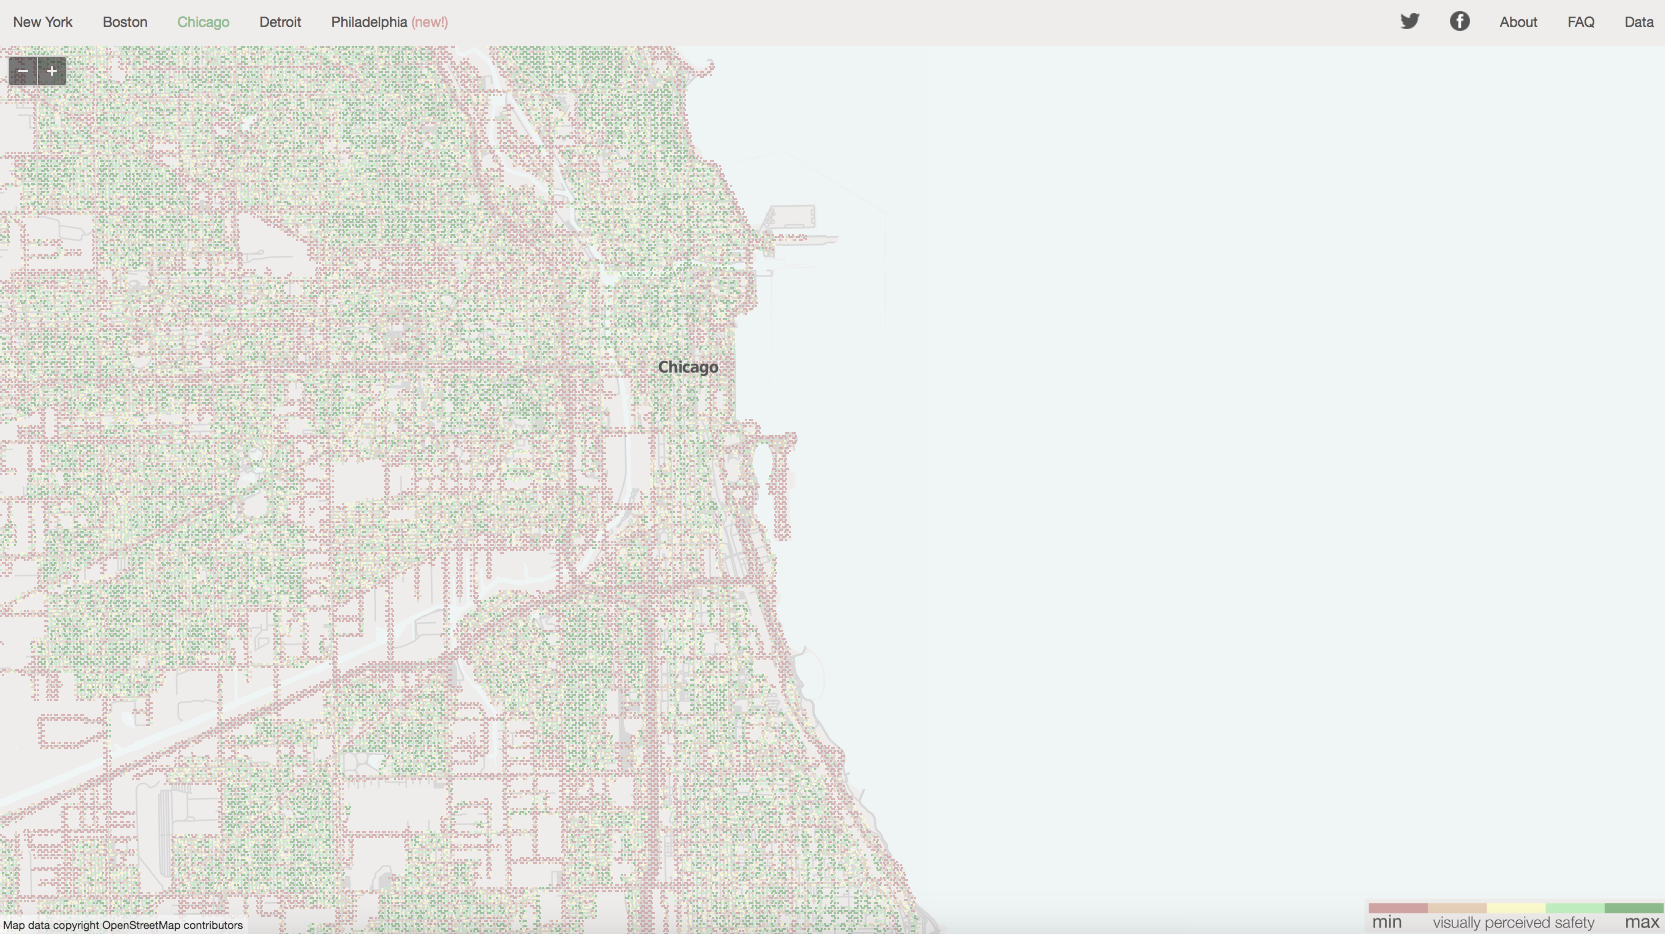
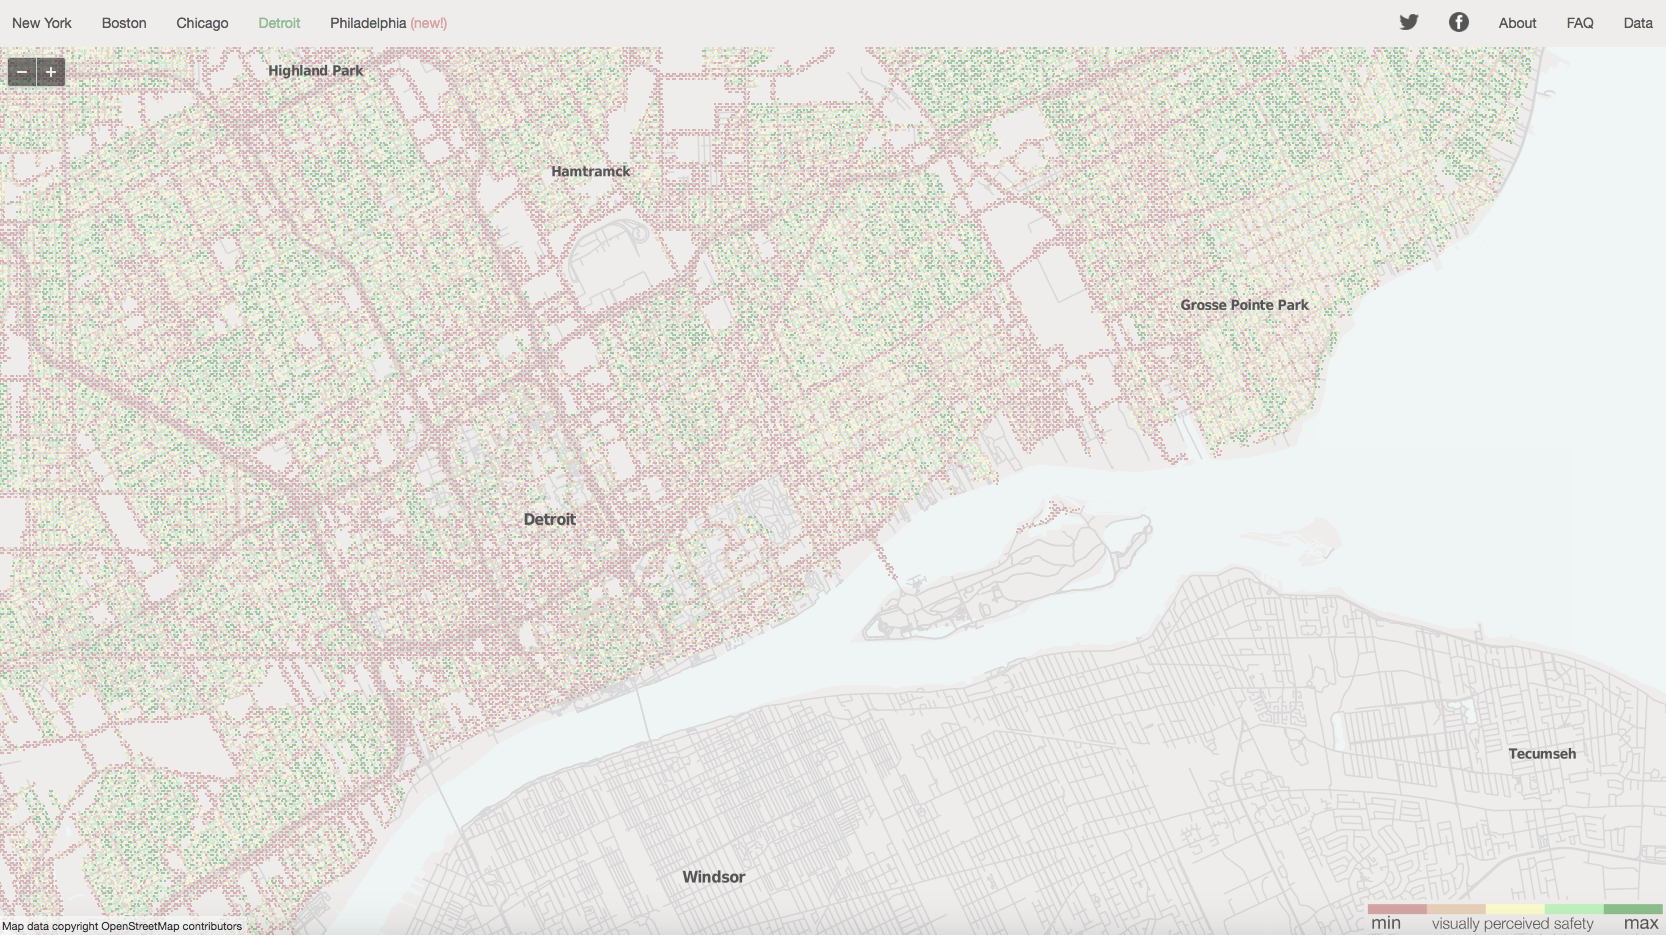
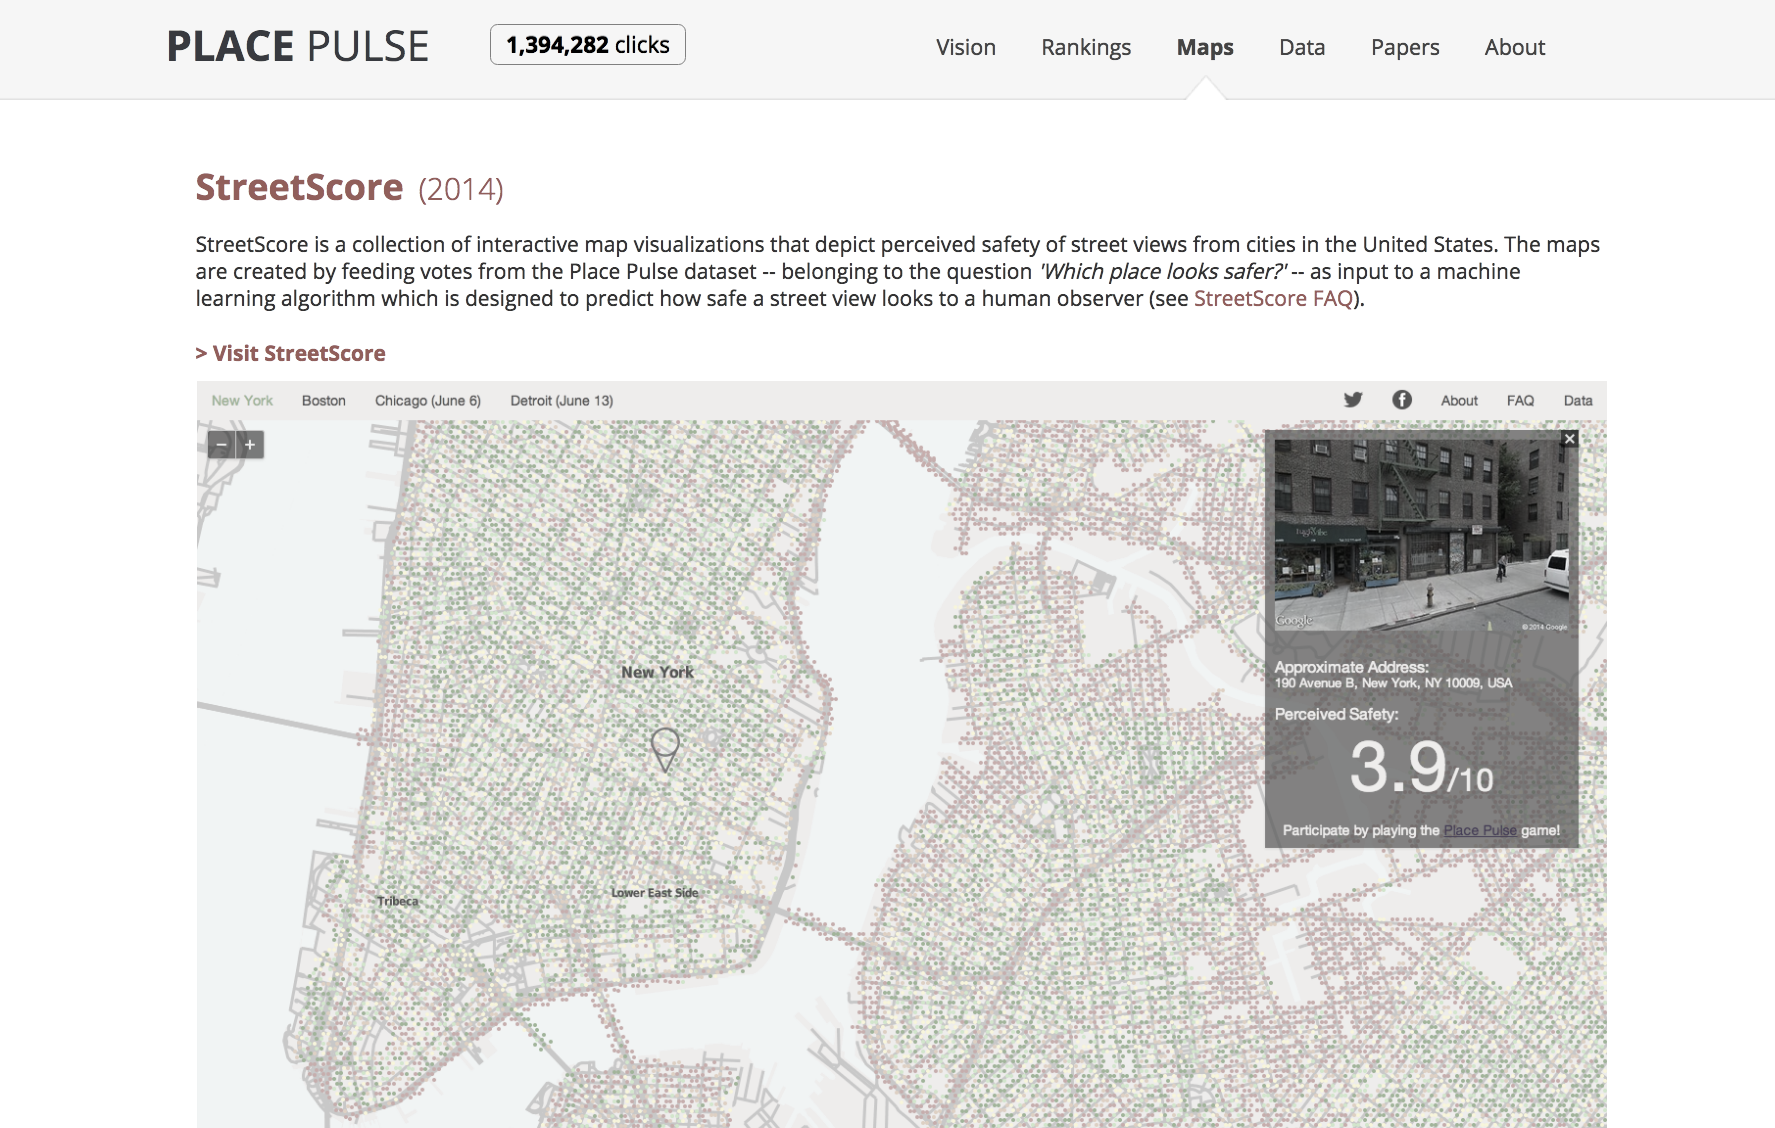
Streetscore is a computer vision algorithm that estimates people's perception of urban environments. We have used Streetscore to create high resolution maps of urban perception with the goal of studying the social impact of urban perception, and also, to study urban change.
Streetscore was created together with Nikhil Naik. The Streetscore website was created together with Nikhil Naik and Jade Philipoom.

Pantheon is an effort to map our species collective memory by structuring data on the biographies of globally famous indivdiuals. Pantheon 1.0 was developed by Amy Yu, in collaboration with Kevin Hu and Shahar Ronen.

DataViva made available data for the entire economy of Brazil, including exports and imports for each municipality and product, and occupation data for every municipality, industry, and occupation.
DataViva was created in a collaboration between FapeMIG, DataWheel, and the Macro Connections group at the MIT Media Lab.

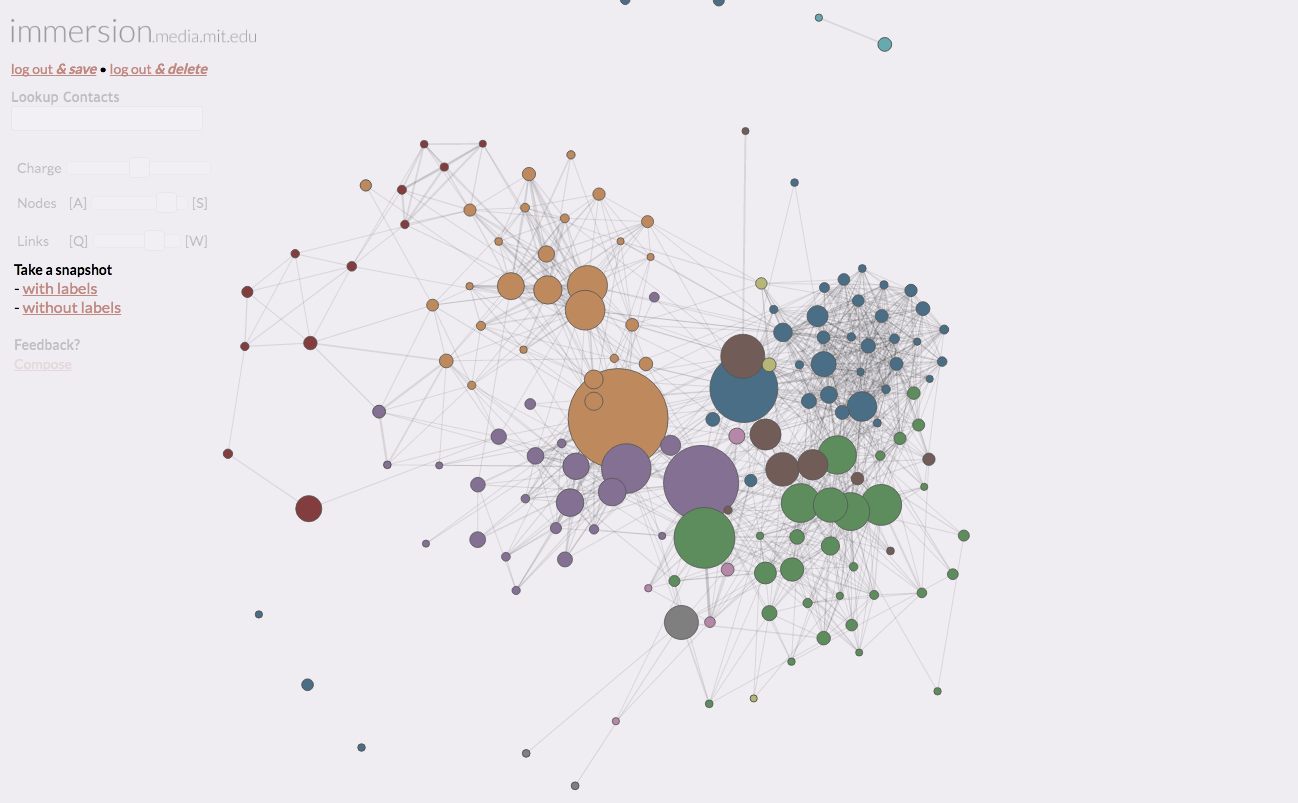

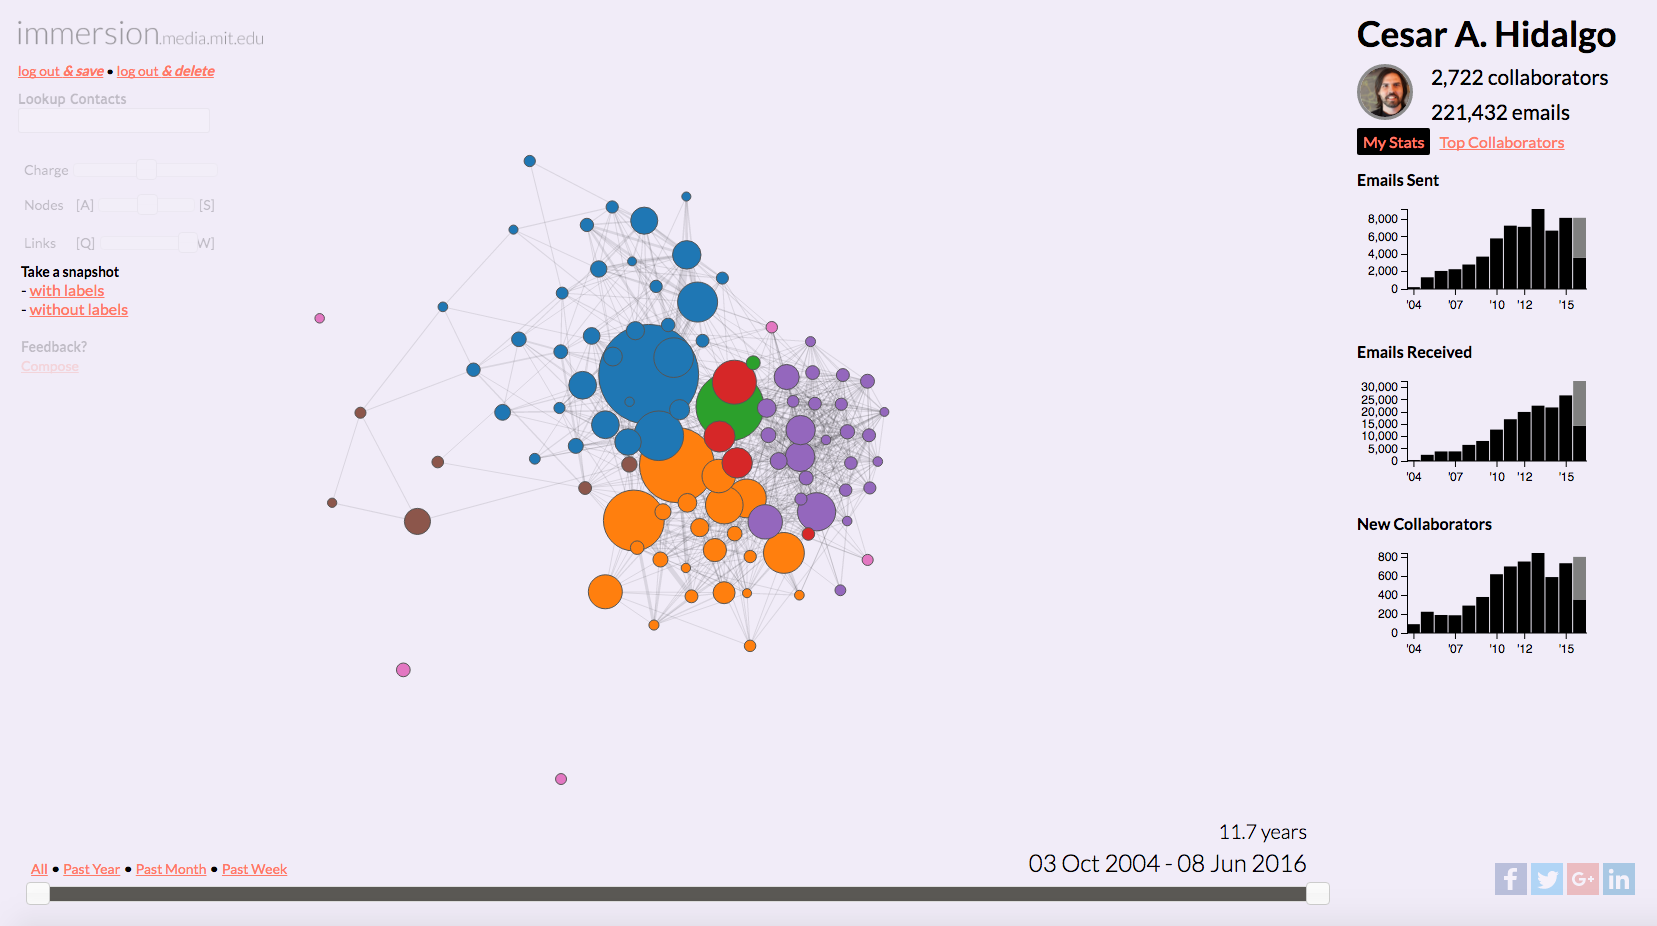
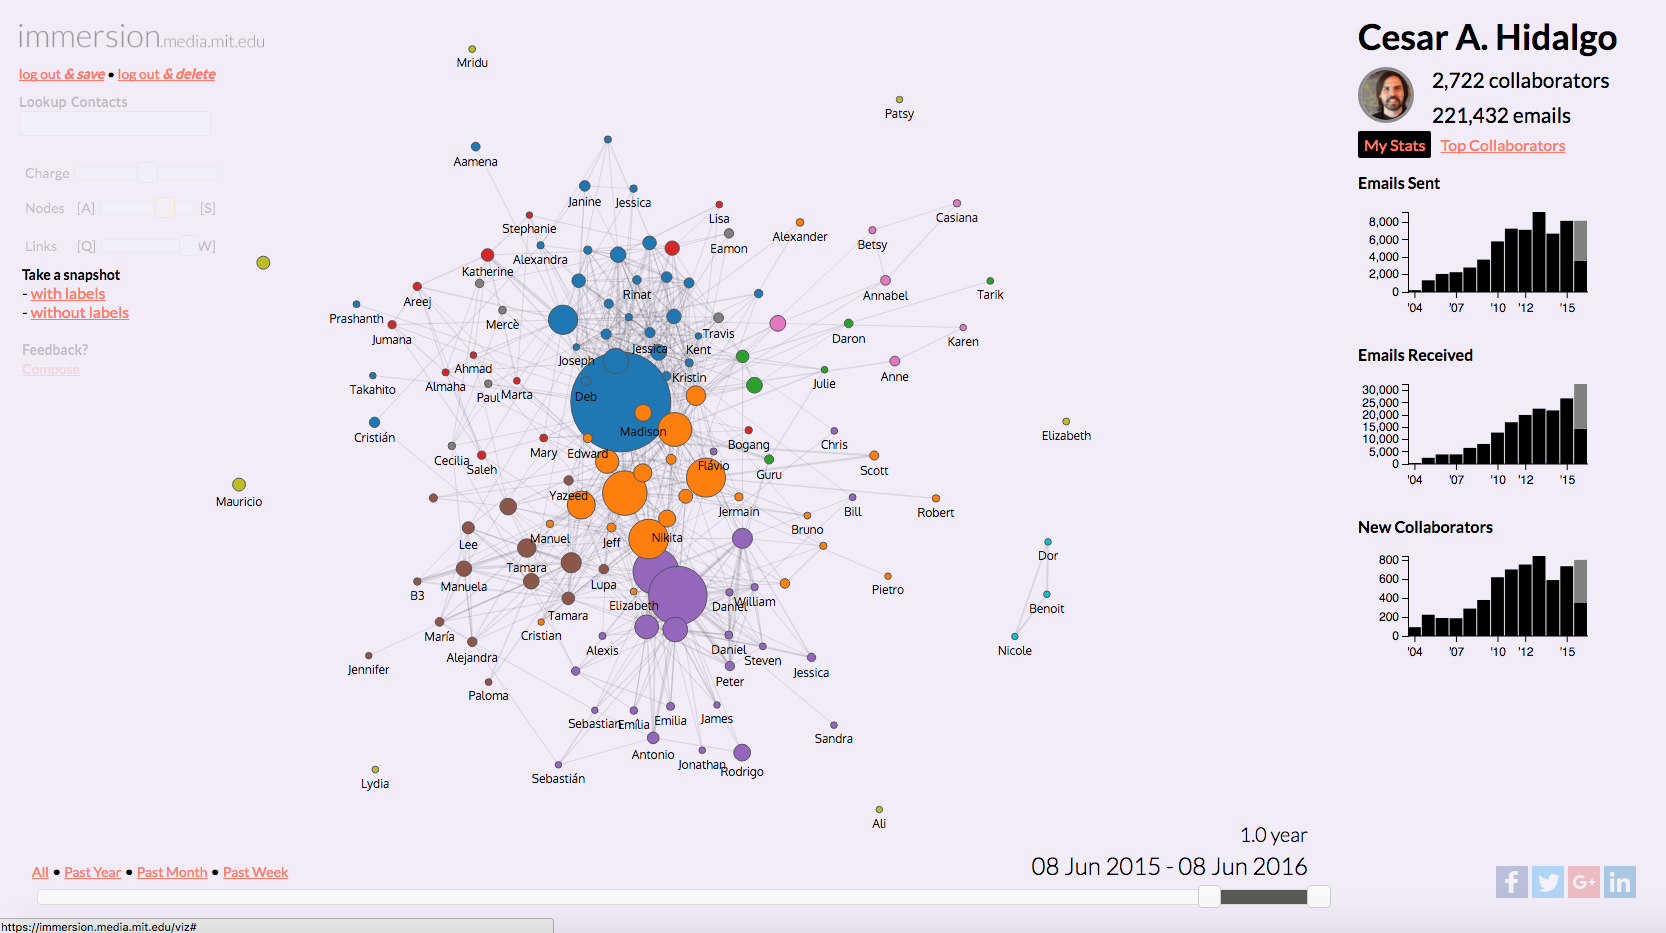
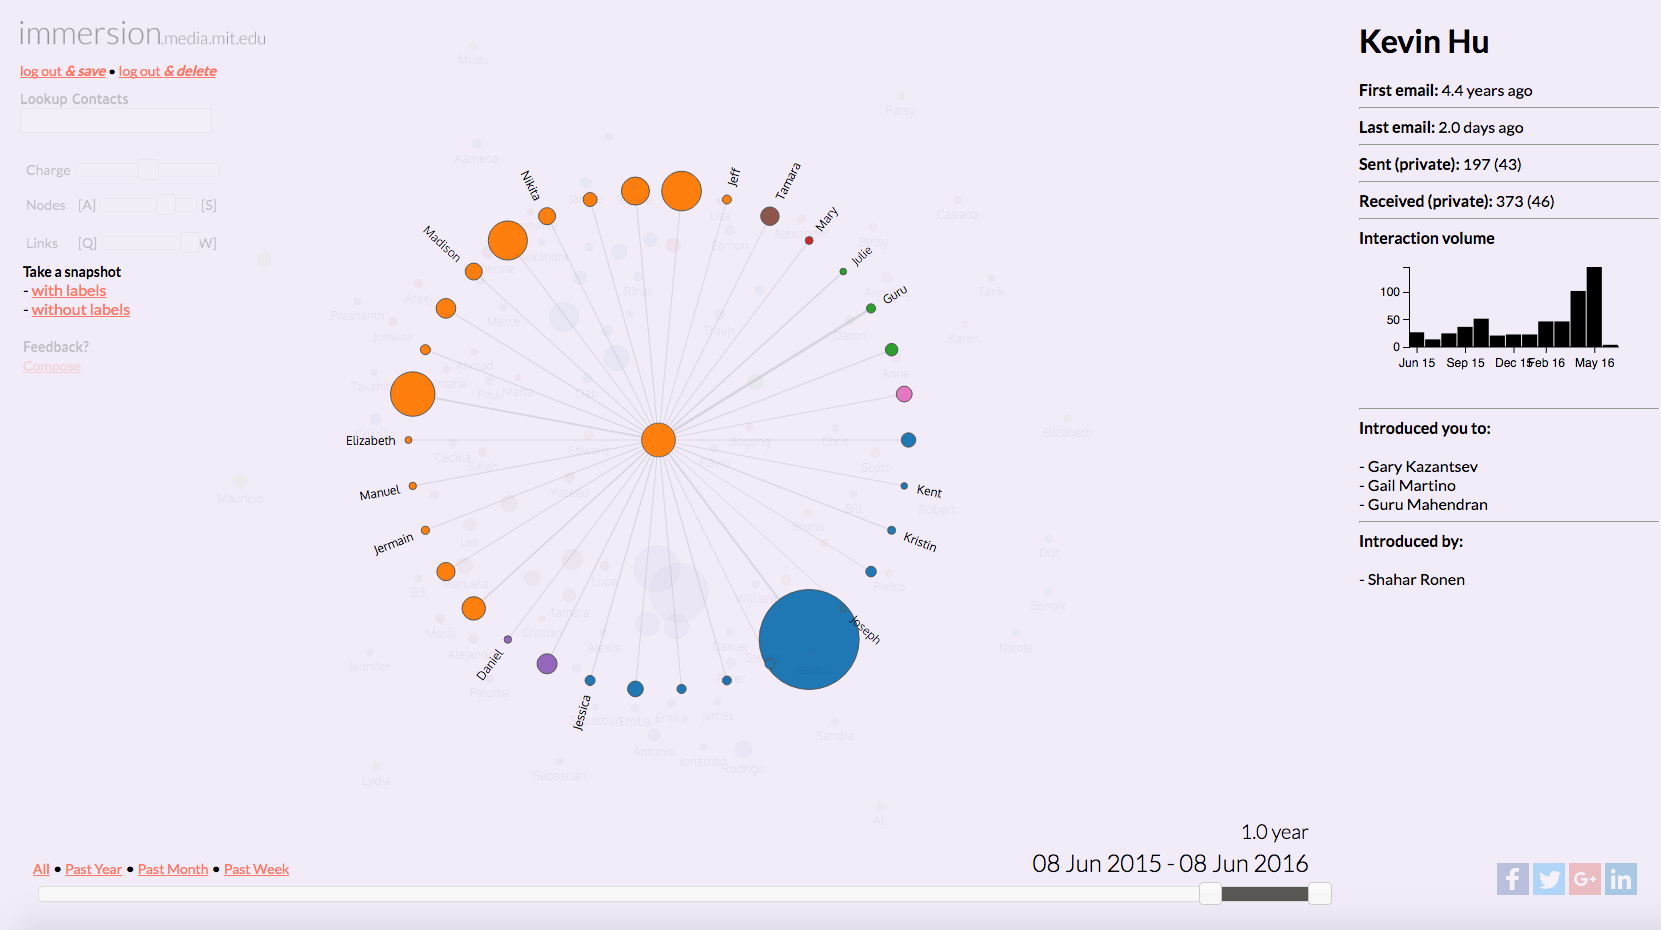
Immersion. The current interface of emails is designed around time, and messages, pushing people to focus on what is more recent rather than important. Immersion is a design experiment that centers the email interface on people and the networks that people form.
Immersion was developed by Daniel Smilkov and Deepak Jagdish as part of their requirement for a Masters in Media, Arts, and Sciences.

Participie was a design experiment on direct participation with constrained choices (like budgets). Participie was developed by Ali Almossawi as part of an independent study class.

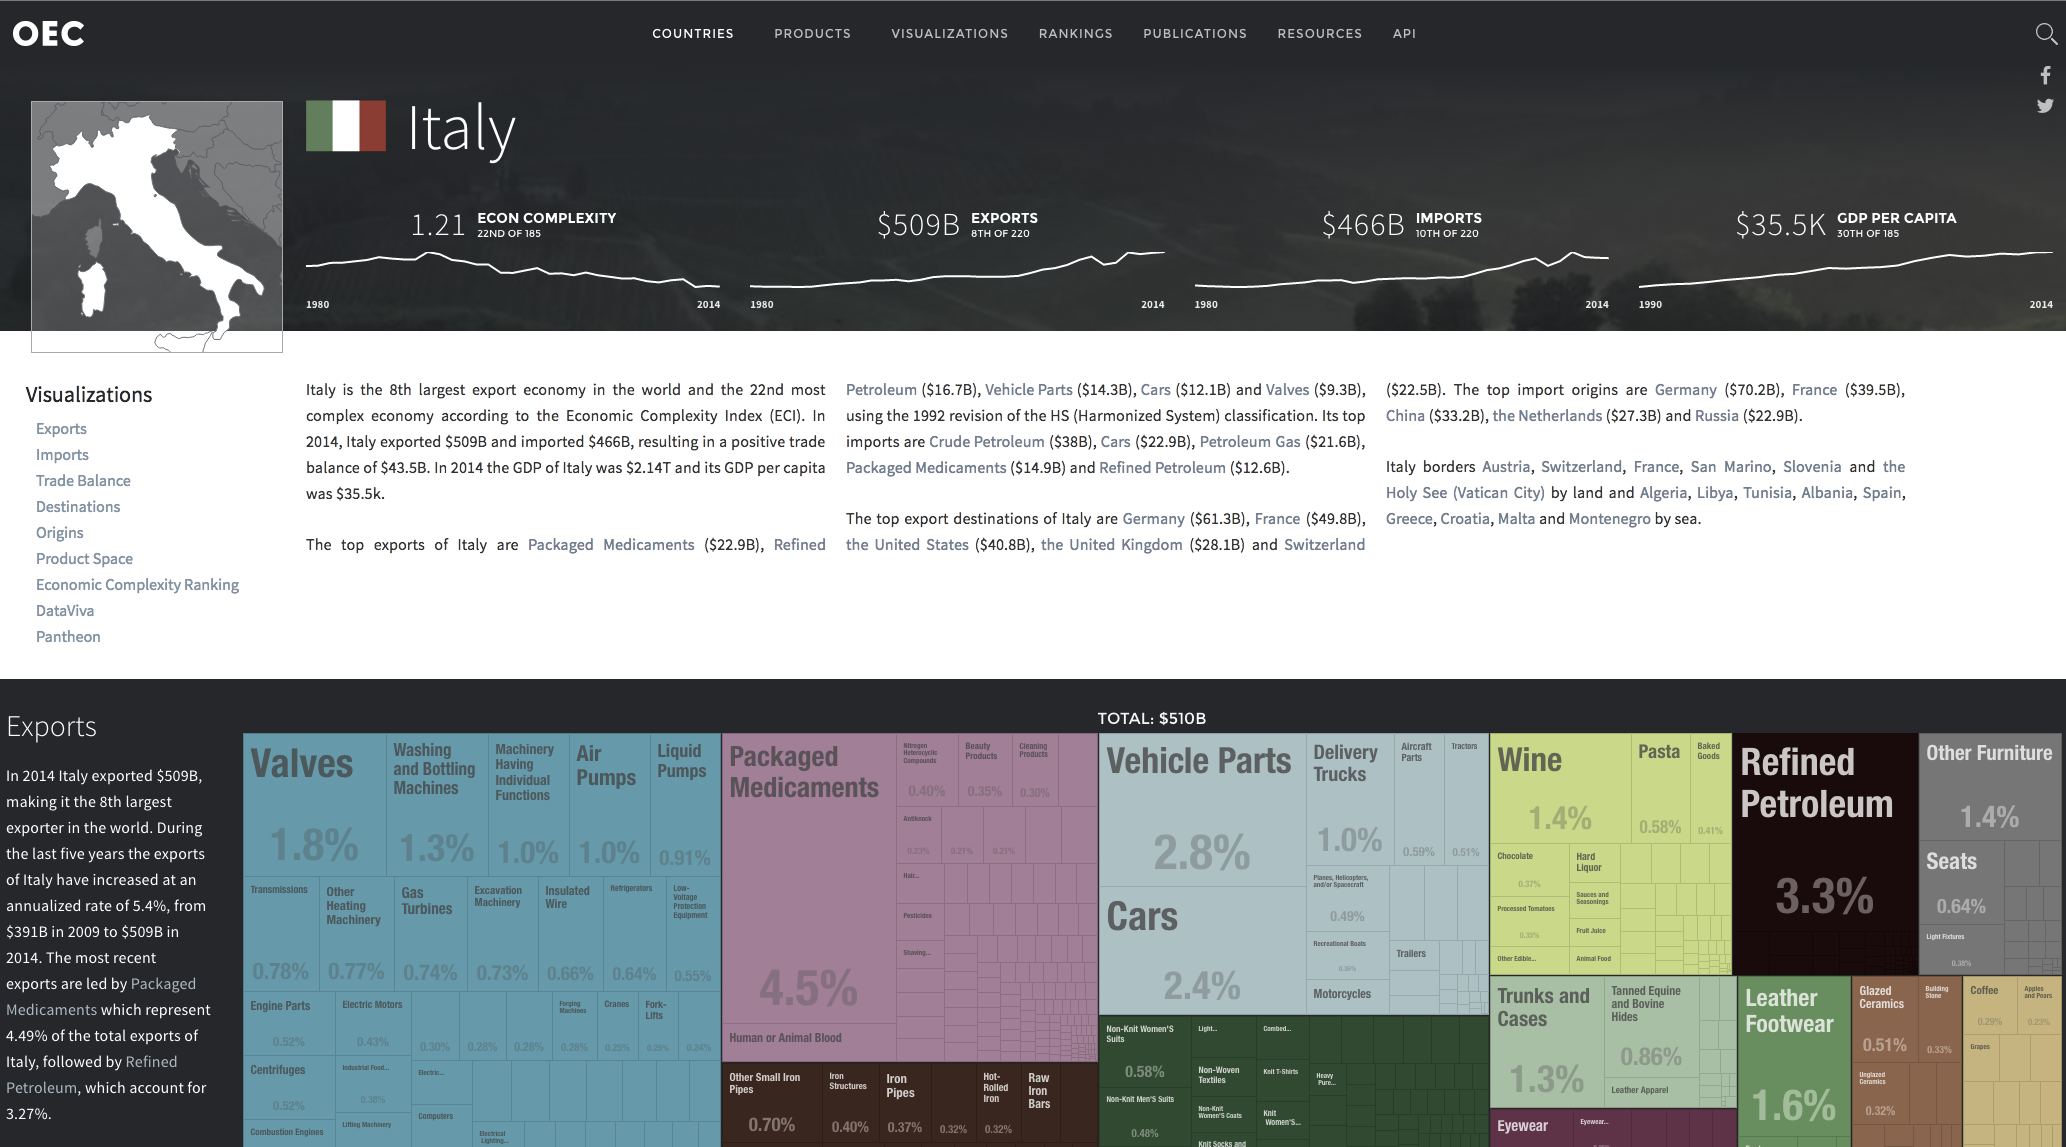
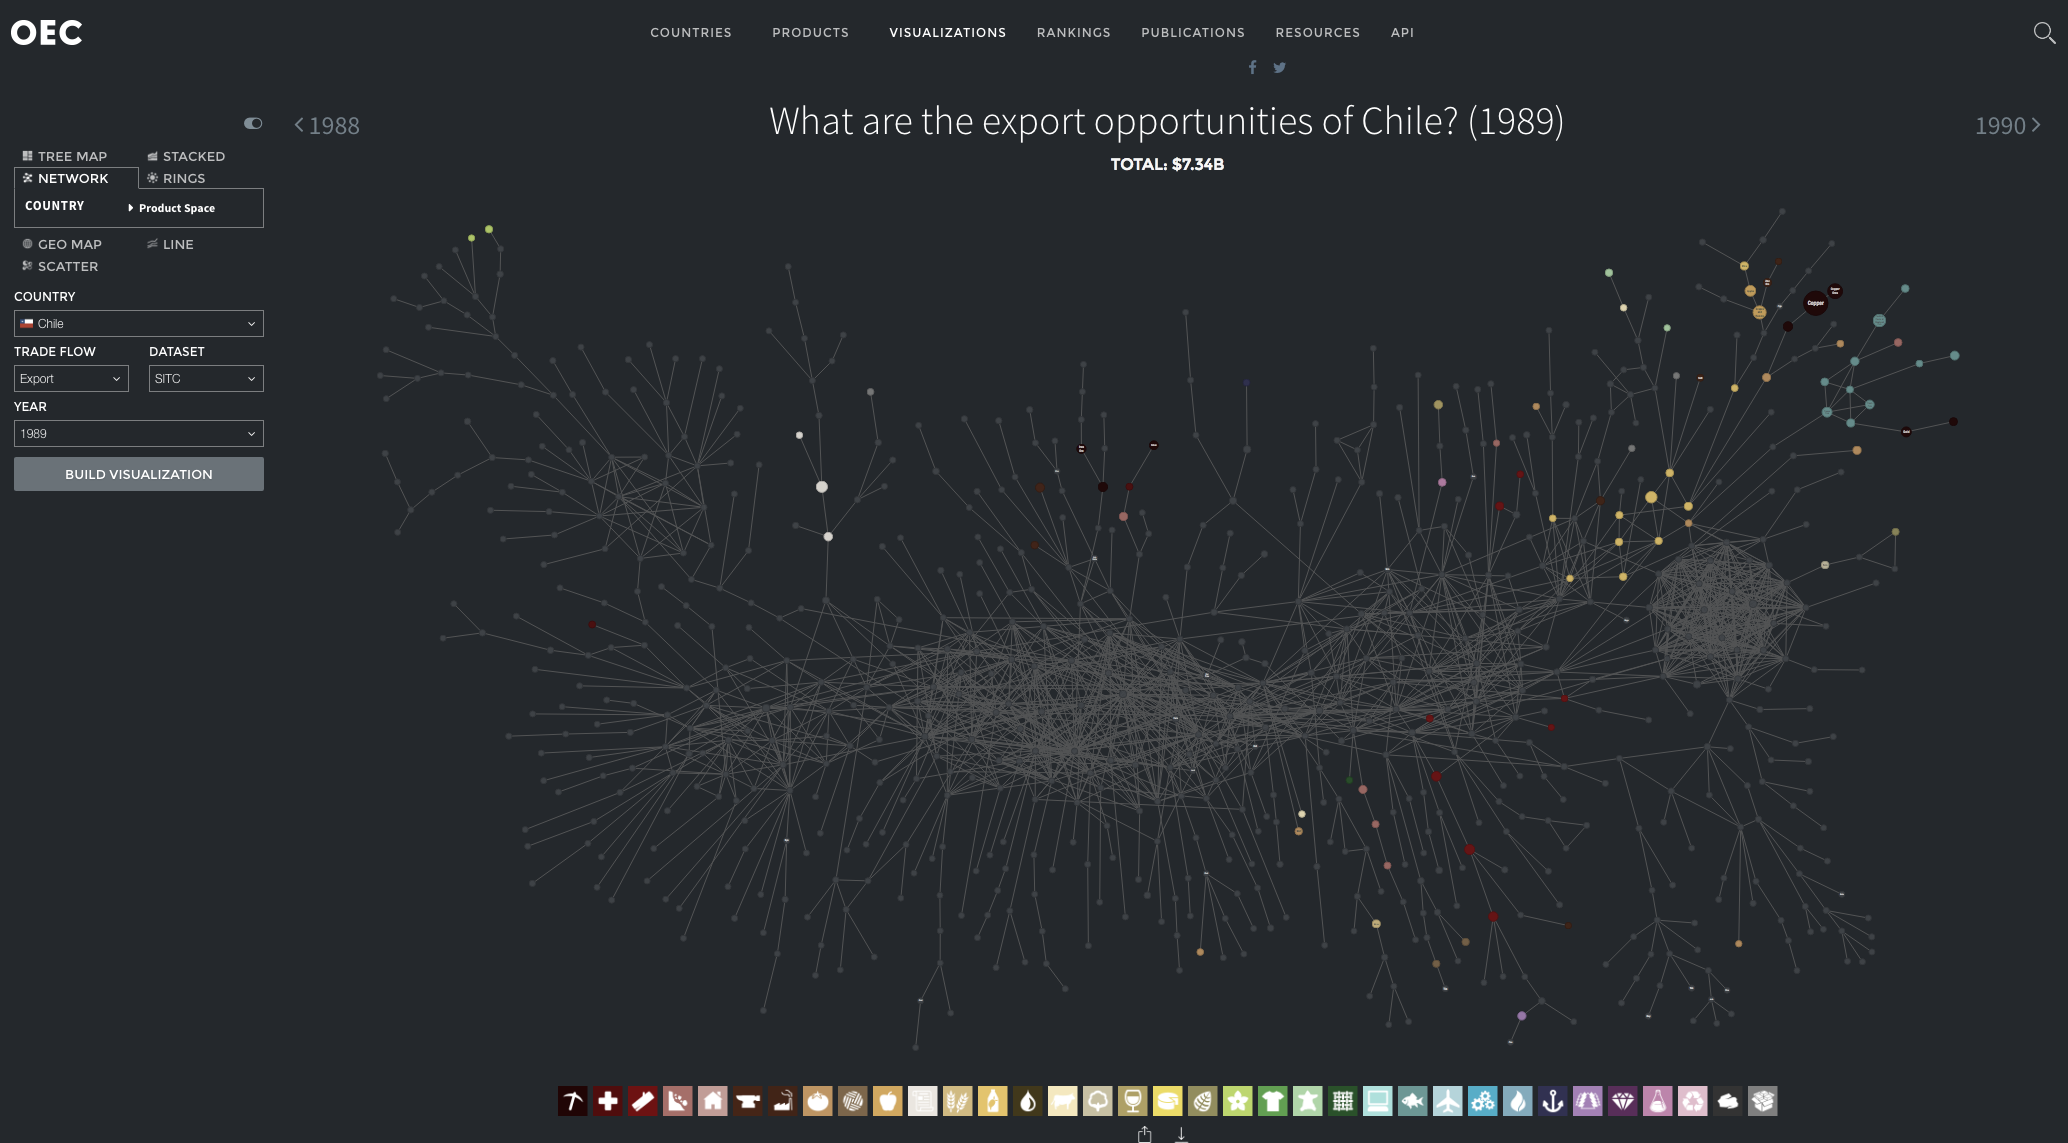
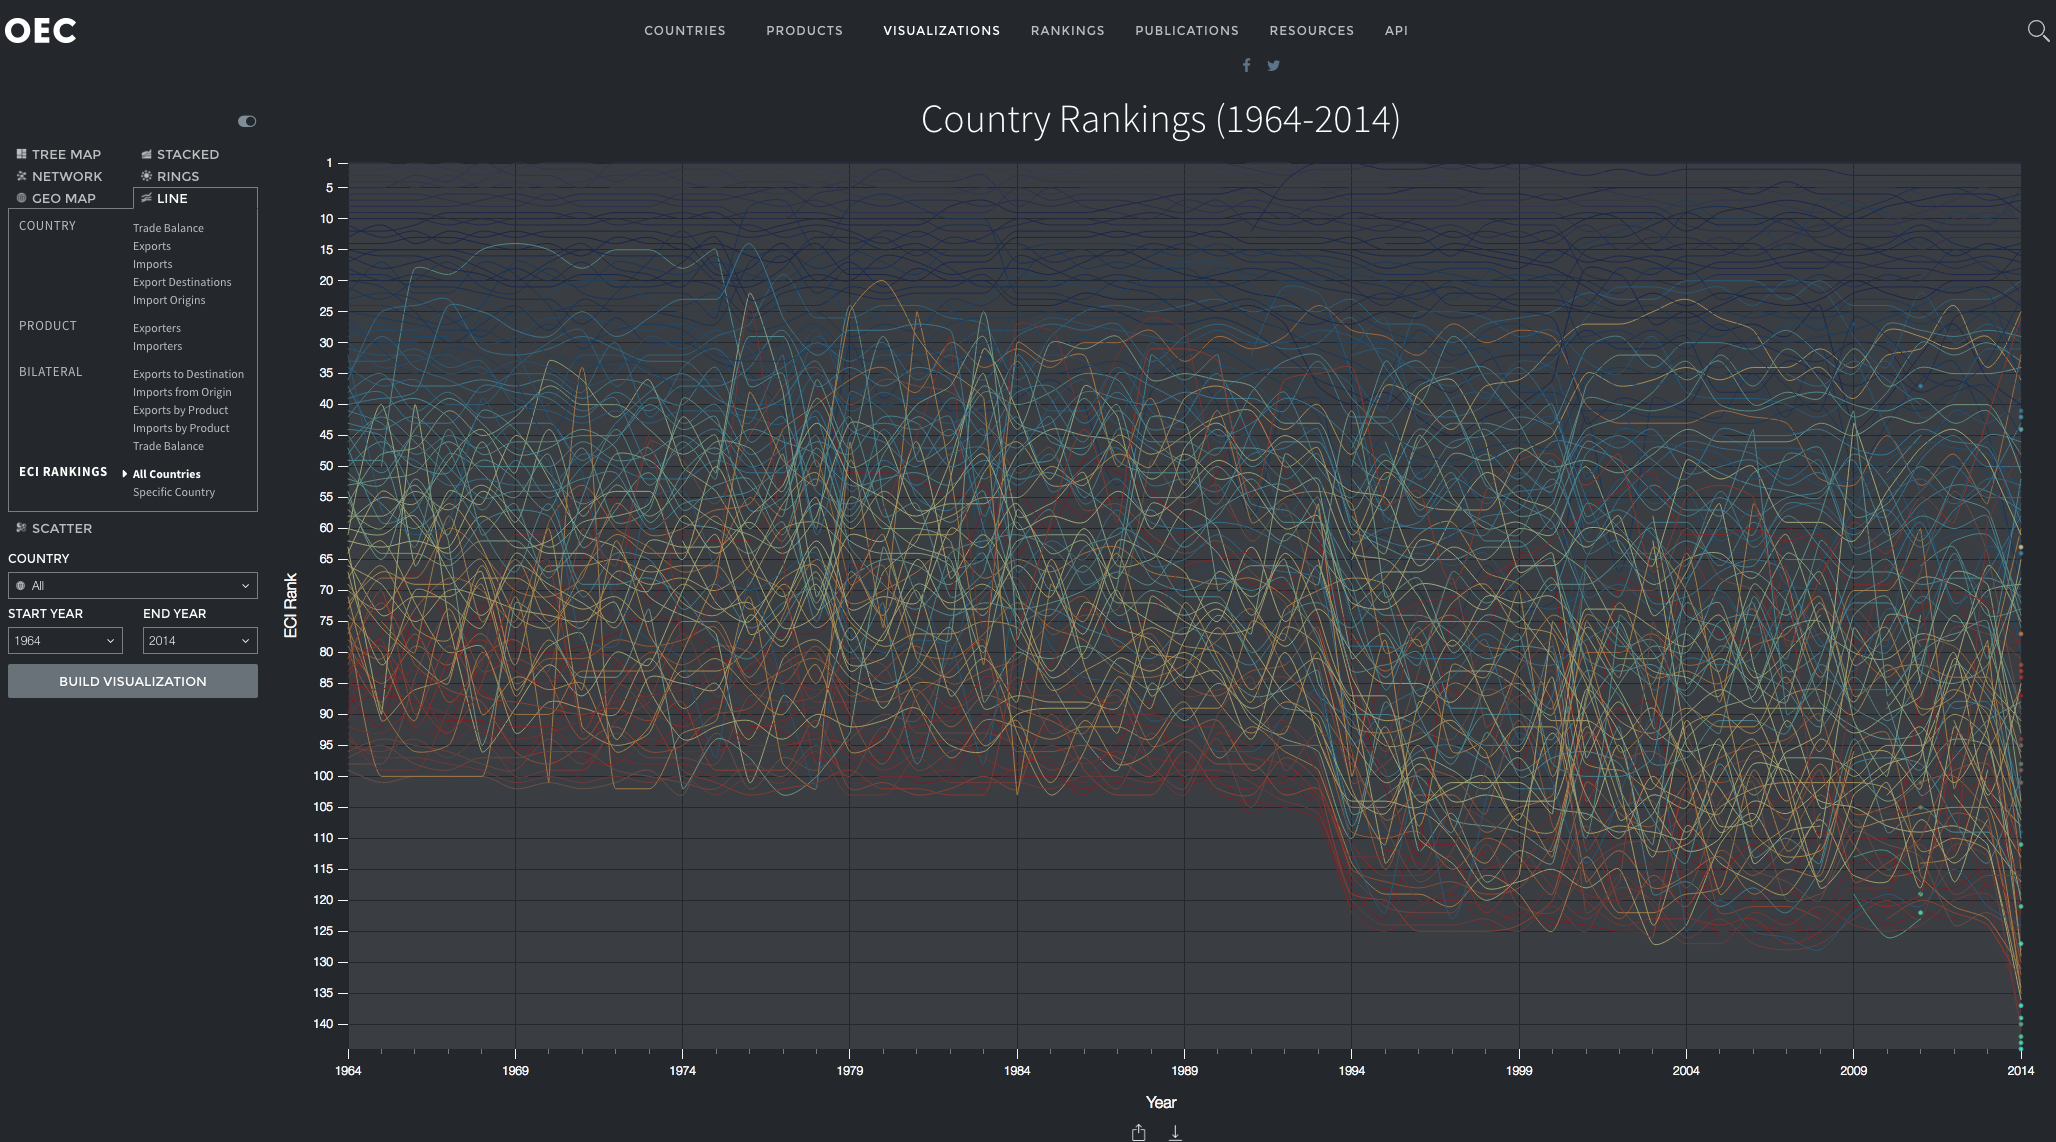
The Observatory of Economic Complexity (OEC) makes more than fifty years of international trade data available through dozens of millions of interactive visualizations. It is the world’s most popular site to visualize international trade data.
The OEC was developed by Alexander Simoes as part of his requirement to complete his Masters in Media, Arts, and Sciences.


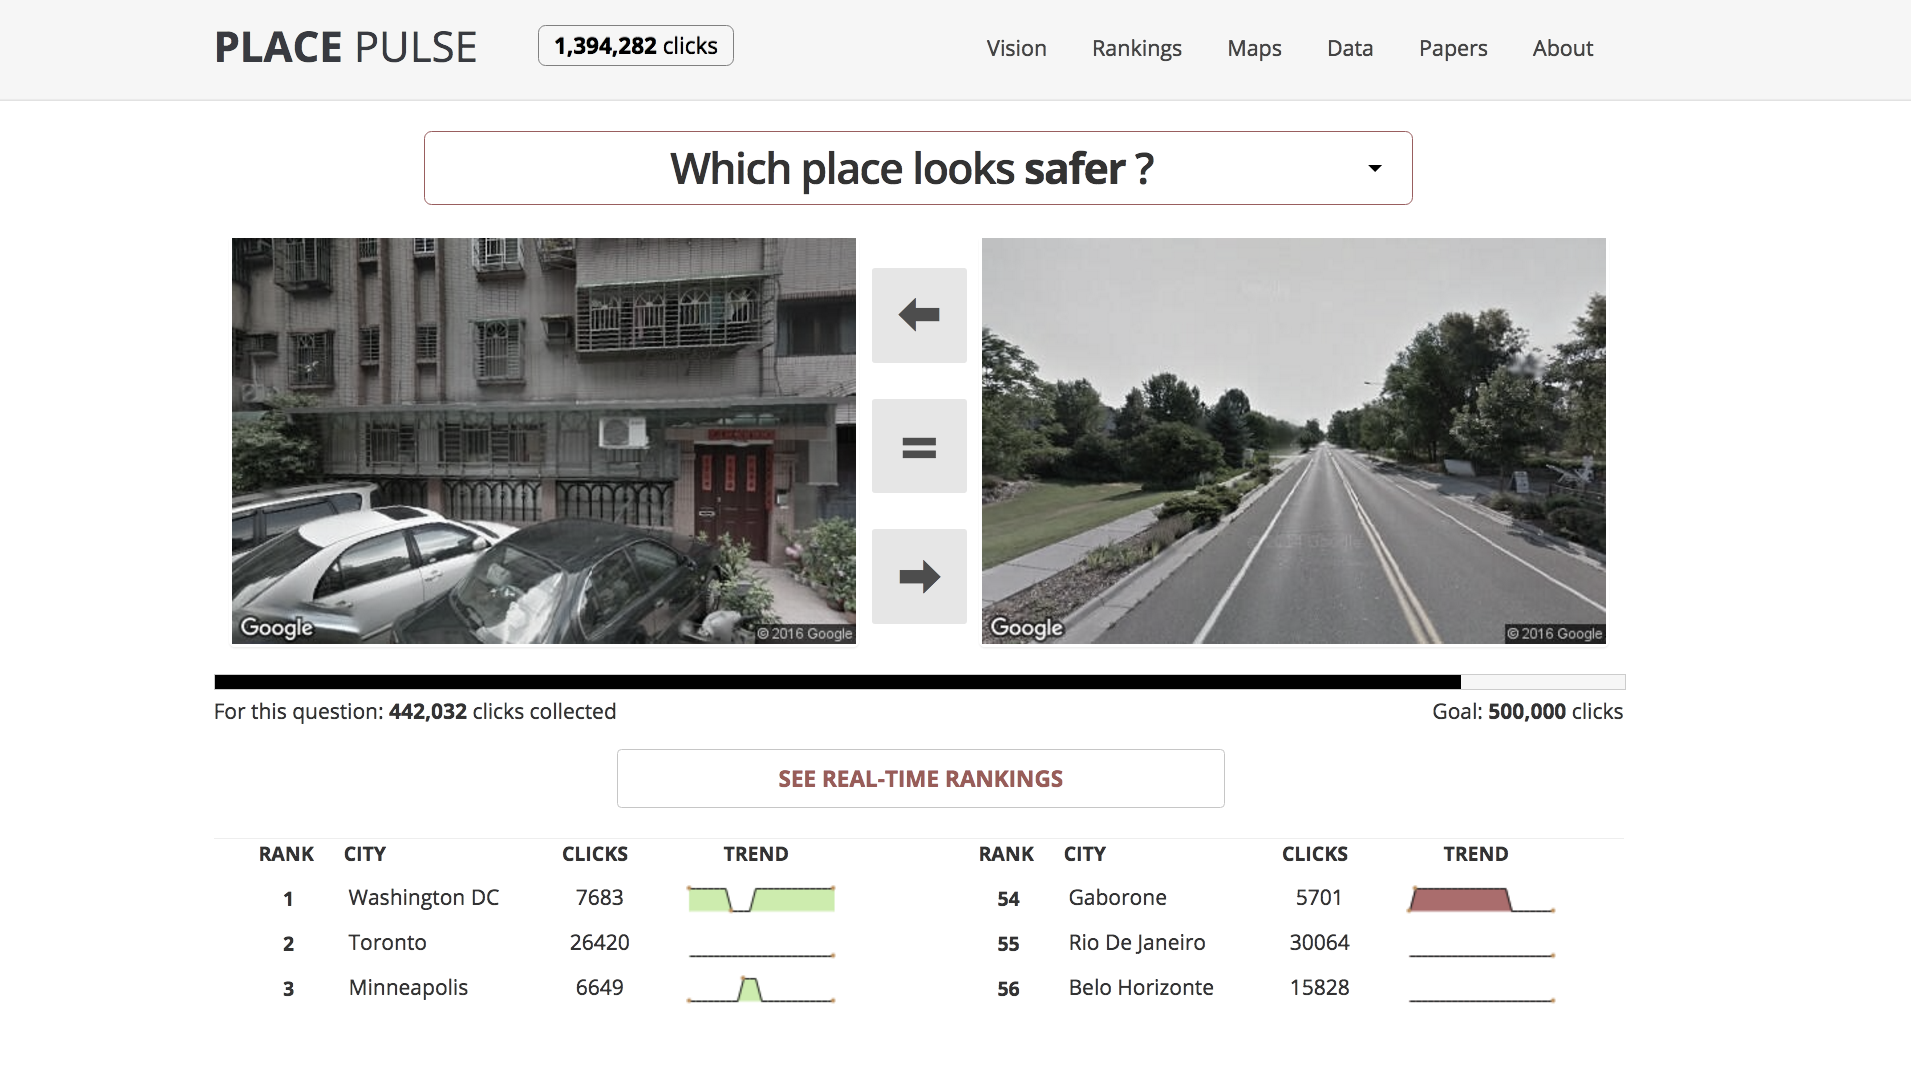
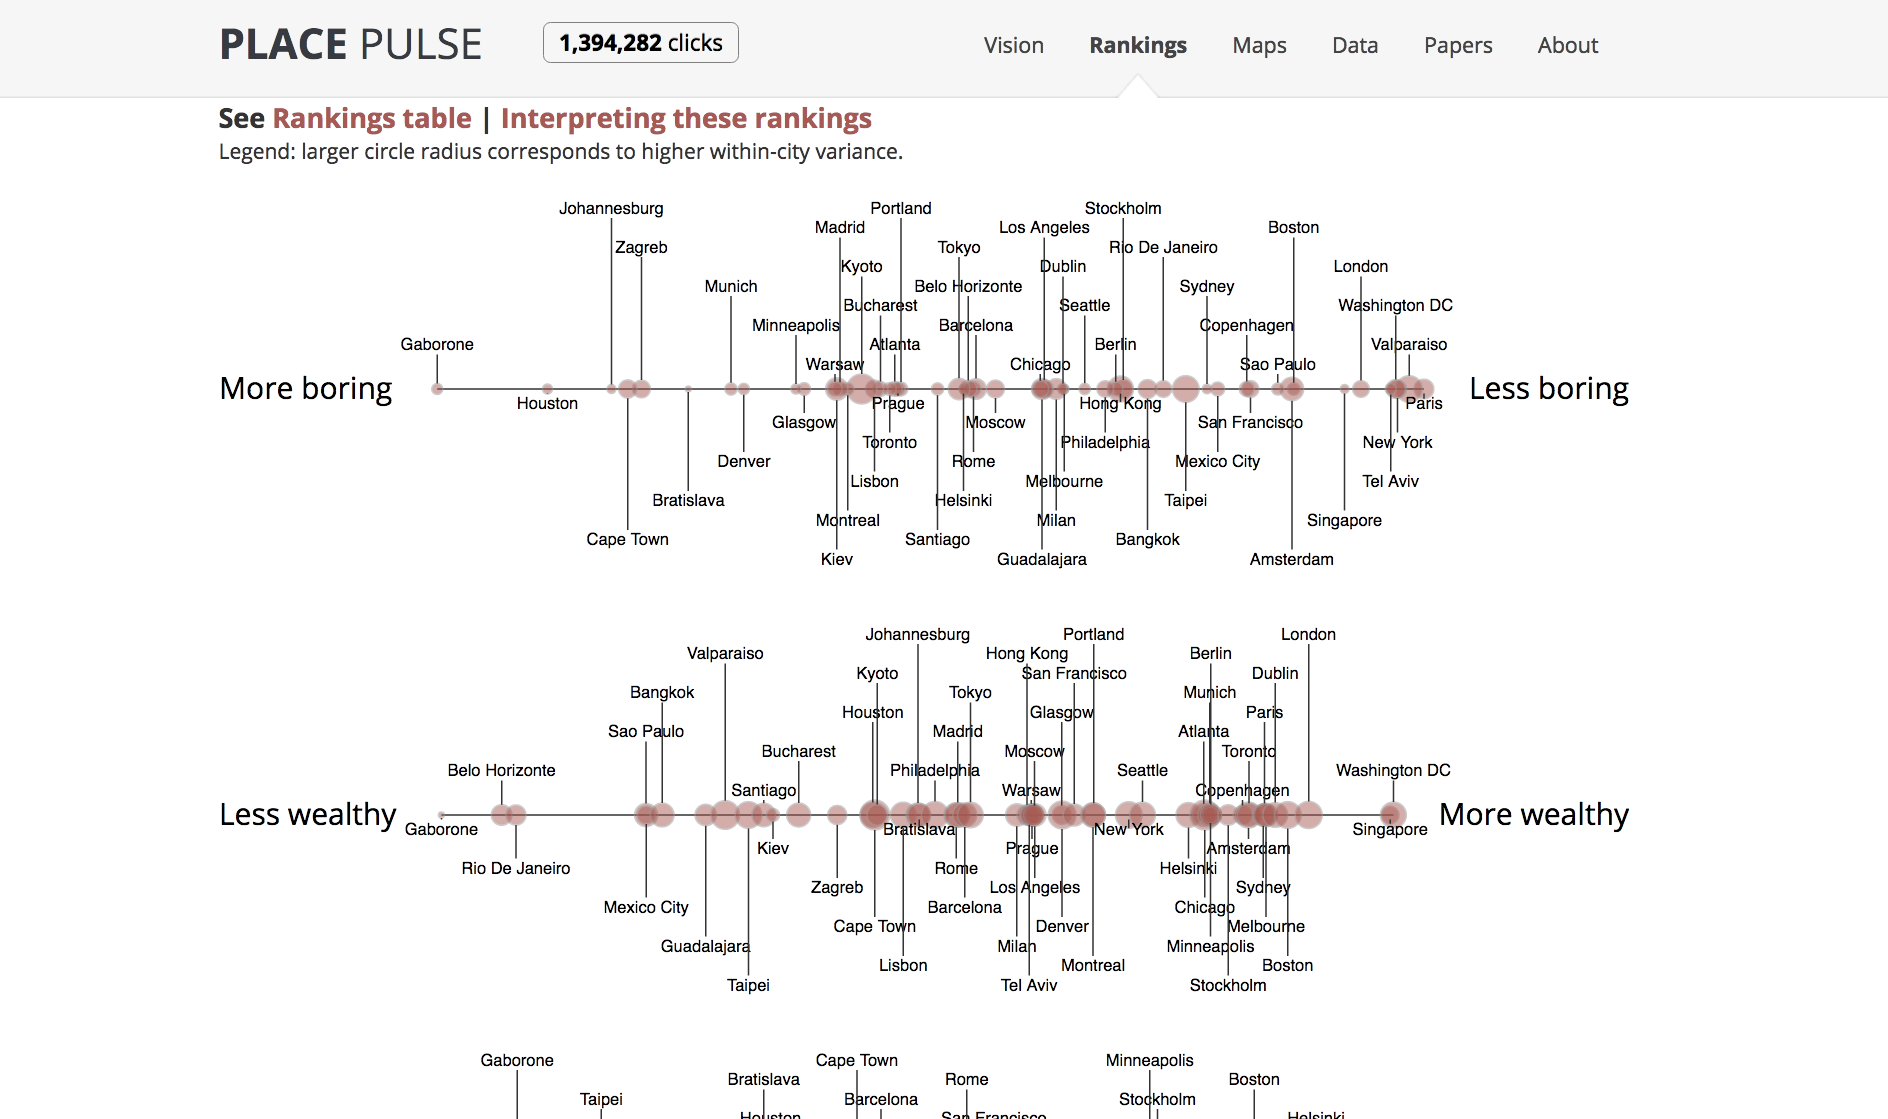
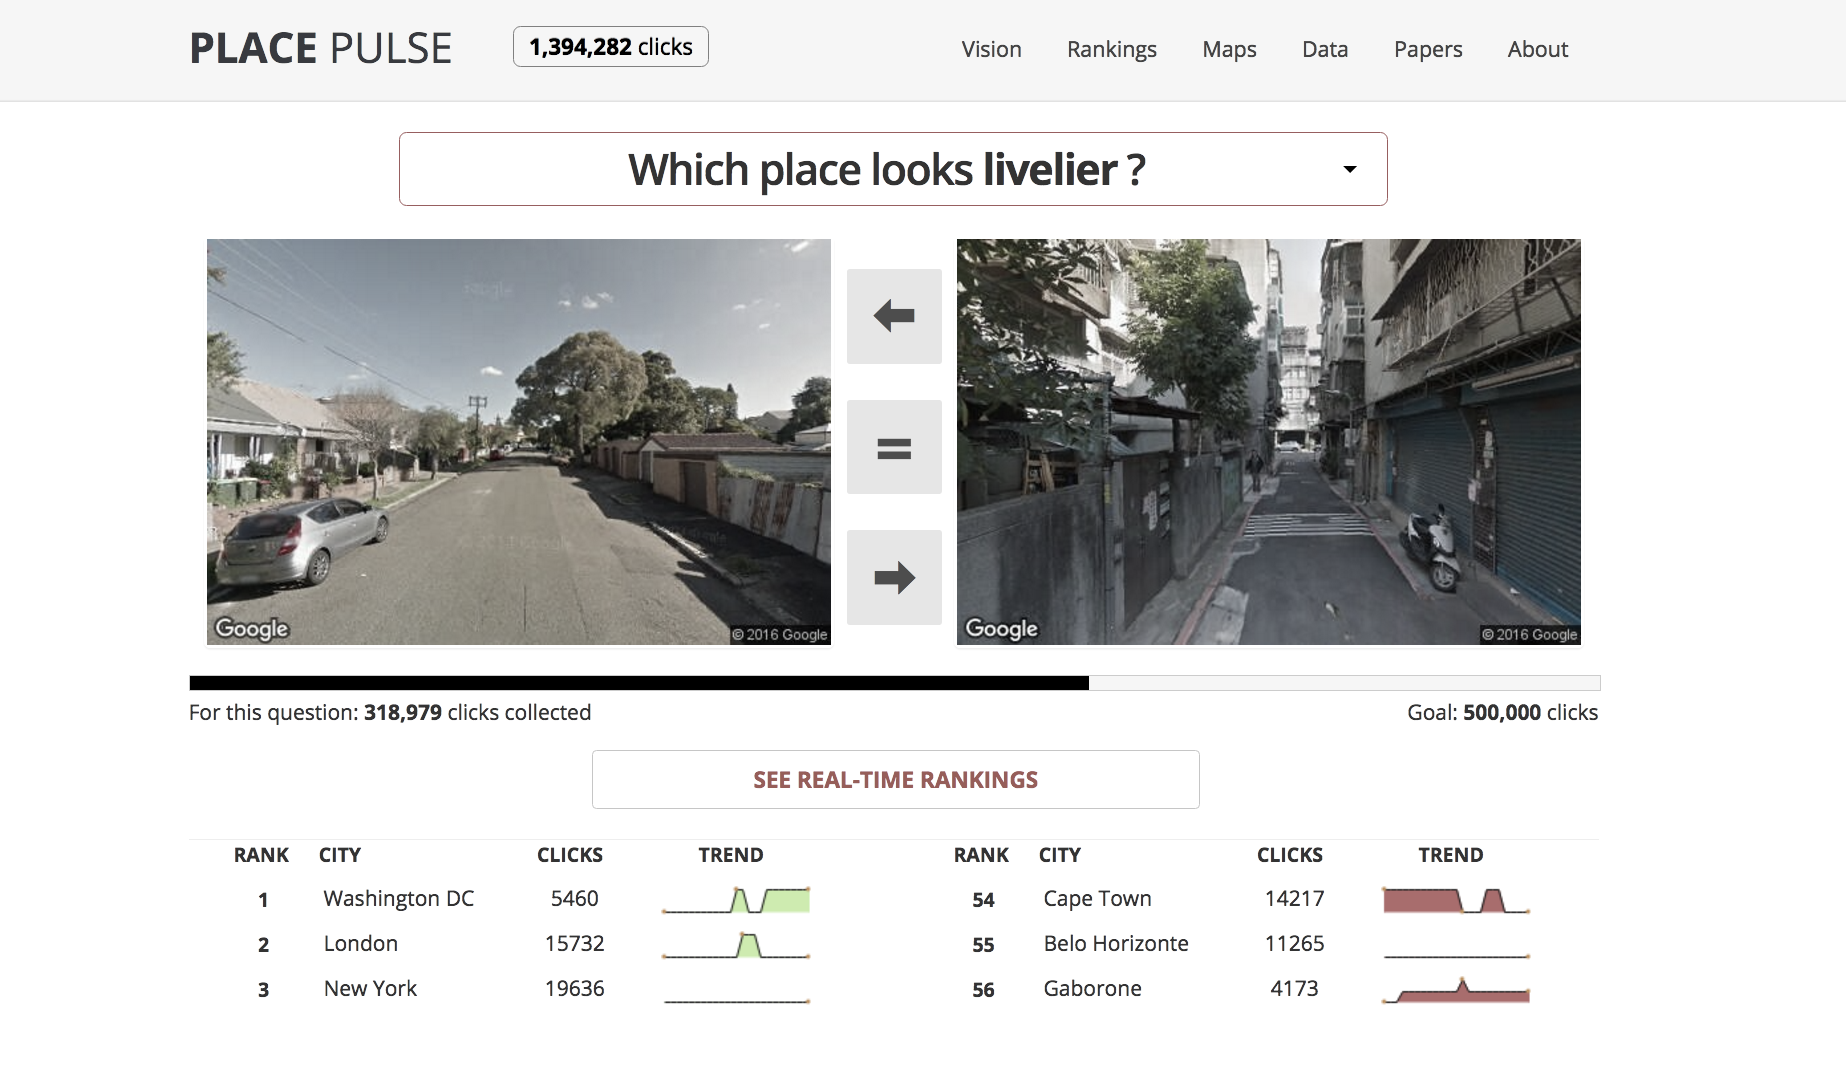
Place Pulse is a crowdsourcing effort to map urban perception. By asking users to select images from a pair, Place Pulse collects the data needed to evaluate people's perceptions of urban environments. This data is also the data used to train Streetscore.
Place Pulse was developed by Phil Salesses as part of his requirement to complete his master thesis. The present version of Place Pulse was re-engineered by Daniel Smilkov and Deepak Jagdish.
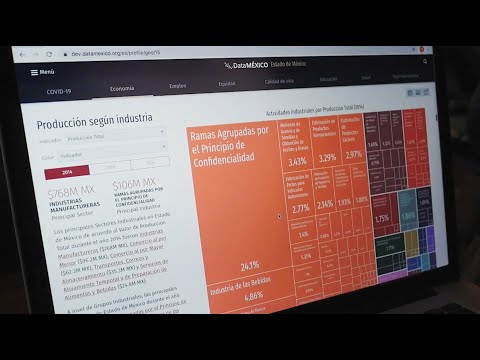
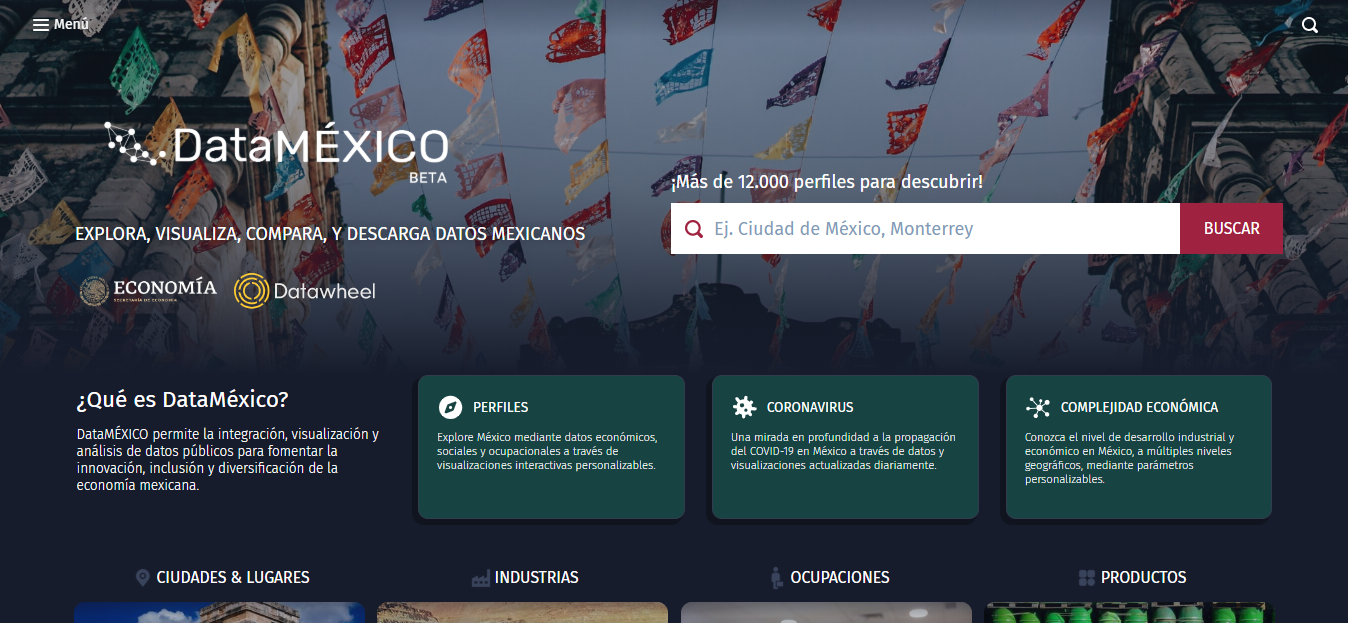
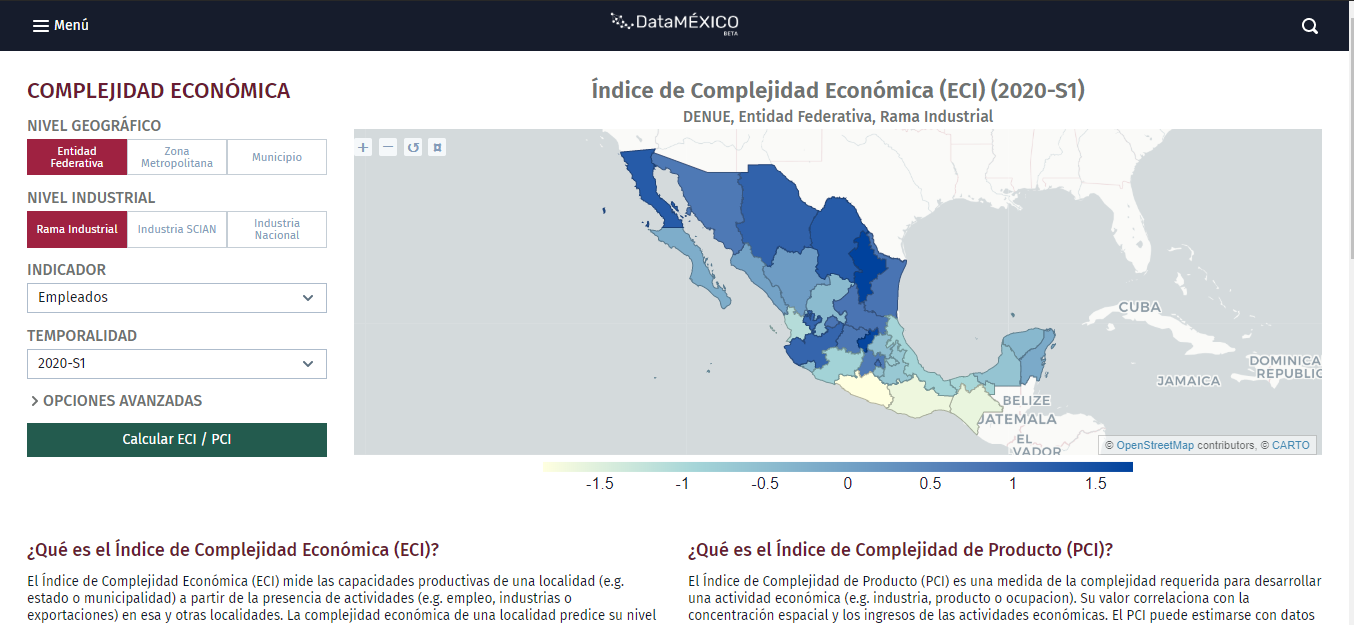
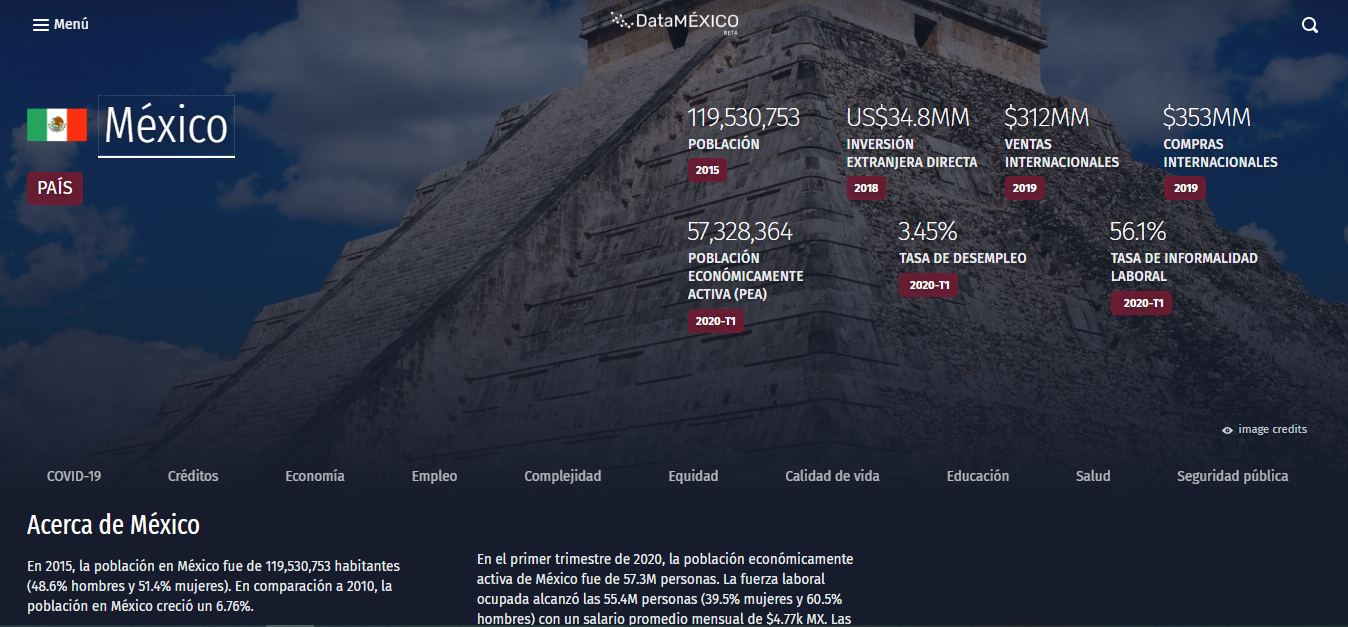
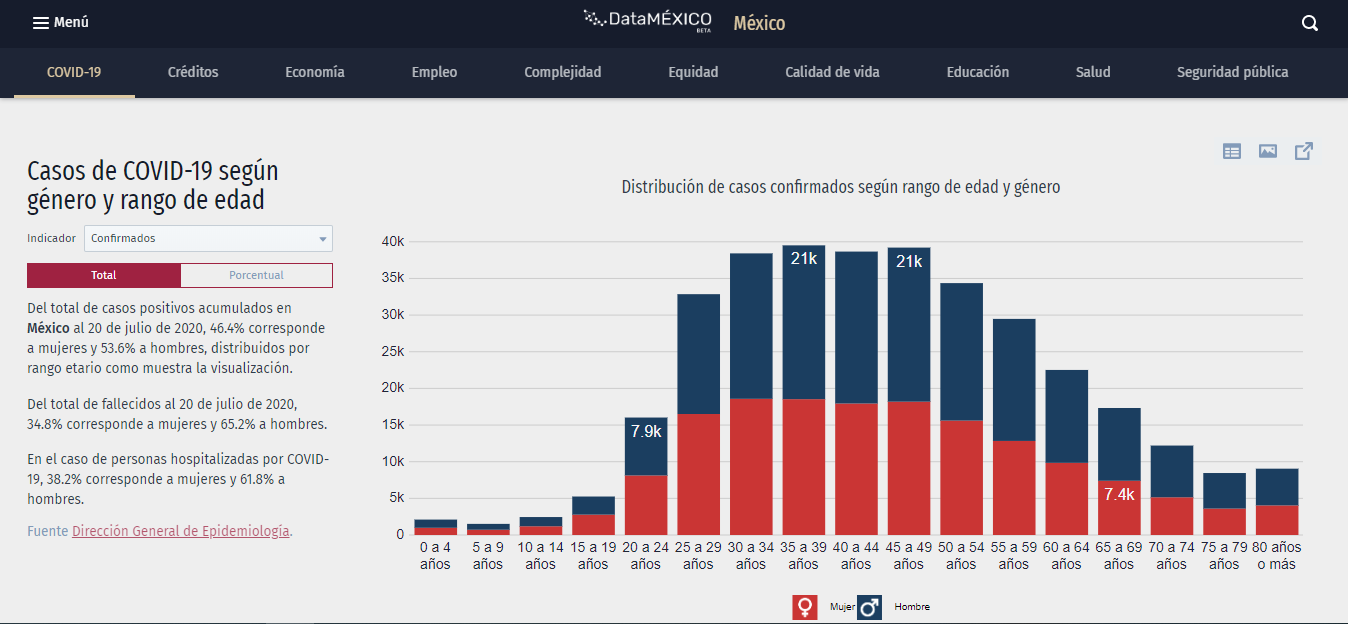
DataMéxico integrates, visualizes, and analyses public data on trade, production, employment, education, demographics, and more. It is a collaboration between DataWheel, Mexico's Secretary of the Economy, and INEGI (National Statistics Institute).